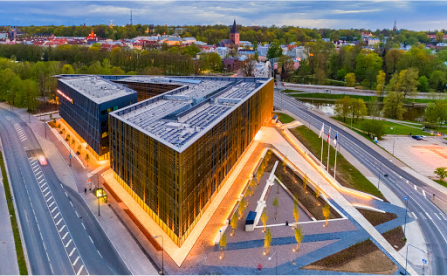
AS Estonian Cell is a Kunda-based aspen pulp mill, which started production in April 2006. It is a perfect example of automation that can produce almost 170,000 tons of wood pulp per year. Estonian Cell’s products are used in paper mills in Europe and Asia as raw materials for different quality papers. The innovative technology used in the factory is environmentally friendly: sulfur-free production, chlorine-free bleaching, lower water consumption and high wood yield.
What did we solve?
Project 1: One of the biggest challenges for manufacturing companies is usually downtime. It must also be ensured that existing technology is used as efficiently as possible. However, the point, when increasing production capacity is leading to production downtime, can be predicted through analyzing and using machine learning models.
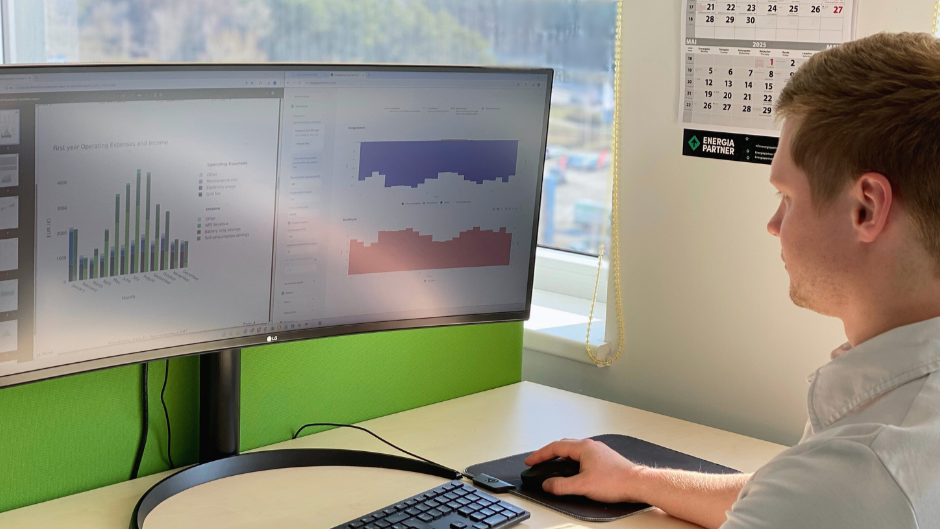
Project 2: In order to make the right and well-timed decisions in a production plant, it is important to obtain and analyze relevant information about the processes. One of the most important units of a pulp mill is a wastewater treatment plant and its parameters which allow the amount of chemicals to be adjusted to the requirements. An efficient wastewater treatment plant ensures that the water flowing back from the plant to the environment is clean. Due to the large amount of data, the fastest and most comprehensive overview can be achieved using the visual analytics dashboard.
“Working with STACC is a good example of how complex tasks in practice can be solved easily and clearly.” –
Ergi Prommik, quality leader
How did we solve it?
Project1: In order to make valid conclusions, we had to find connections in the data. For that we connected the EC database, developed a semi-automatic data transmission and data aggregation pipeline. Based on the segmentation and analysis of the data, we tried to find out whether there is a link between downtime and capacity.
Project 2: We developed a dashboard application that can be used to visualize data separately and together. We also added an integrated capability for simpler data analysis to the application.
What are the benefits?
Project 1: The results of the performed data analysis can be taken into account in further production planning.
Project 2: The Dashboard solution completes several hours of work in two minutes; it monitors and analyzes the parameters of the wastewater treatment plant.