How do we know what’s happening beneath the soil without even touching it? The answer to this question is useful in many fields, especially farming and agronomy. Our data scientist, Lotta-Lorette, searched for the best answer in collaboration with the Estonian precision farming company eAgronom.
Her work focused on soil temperature 5 cm below ground – the most frequent planting depth for Estonian crops. Soil temperature is important to calculate suitable sowing and ploughing times and assess plant growth conditions. The aim was to create a soil temperature prediction model based on other environmental parameters. In addition, she compared and analysed existing solutions for assessing soil temperatures.
There is no sensible way to assess soil temperature in most of Estonia
In an ideal world, each precision farmer would install soil sensors on the fields and thus could have accurate and constant readings of the temperatures. However, this approach is resource-intensive and unsuitable for a larger scale. The national weather stations could help, but in Estonia, only four stations have soil temperature readings 5 cm below ground, and they do not cover the whole country. This means that other measures, like predictive modelling or remote sensing, are needed to assess soil temperature for every field in Estonia.
Satellite data for Estonia is scarce and often noisy
How can we see what is happening at once on a large piece of land? Satellites are a good bet. However, after analysing Sentinel 3 and Landsat 8 satellite data in the Estonian region, she found many problems. These satellites use infrared sensors to measure the heat radiation of the Earth, and then the soil temperatures are derived from there. Measurements in a specific point are made only on days when the satellite flies over it. When comparing Landsat 8 measurements to data from 10 different soil sensors, she discovered that for about one year of data, only 21% of days had a satellite measurement. Only 8% of those were considered usable by the satellite data providers, and the analysis showed these data points were far off from the local temperature measurements. An example of this can be seen on Figure 1. In conclusion, the satellites are not suitable for daily soil temperature assessment.
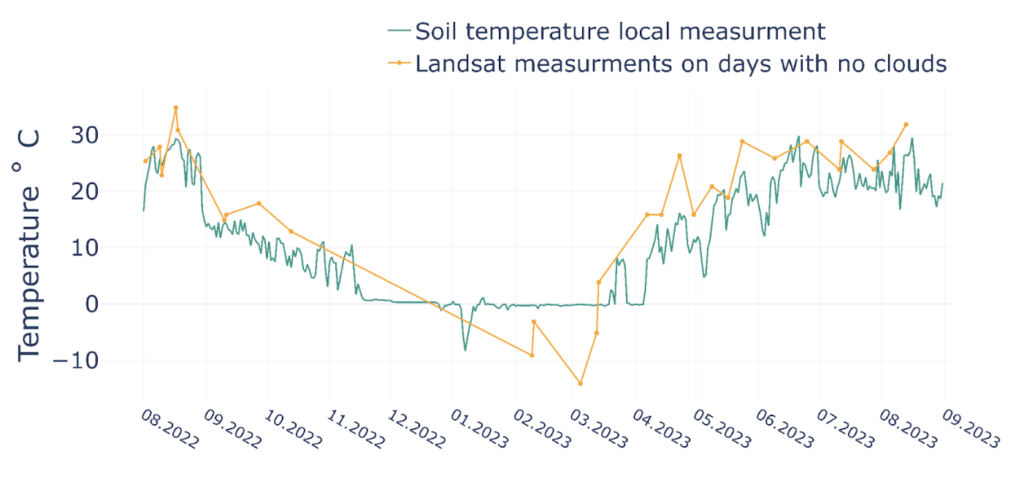
Figure 1. Landsat 8 measurements and actual soil temperatures measured in Tartu-Tõravere weather station.
No need for complexity – a linear regression model gets the job done
Both local and remote measuring did not satisfy the needs of precision farming, so a predictive model was the best option. When modelling soil temperature, it was important to consider some limitations: the actual soil temperature at the predicted location was often not measurable and the other data used in the model had to be as easily accessible as possible. Previous studies have shown a strong linear relationship between air and soil temperatures (Zheng, Hunt and Running, 1993; Hu et al., 2020). Therefore, linear regression models were used to model soil temperature.
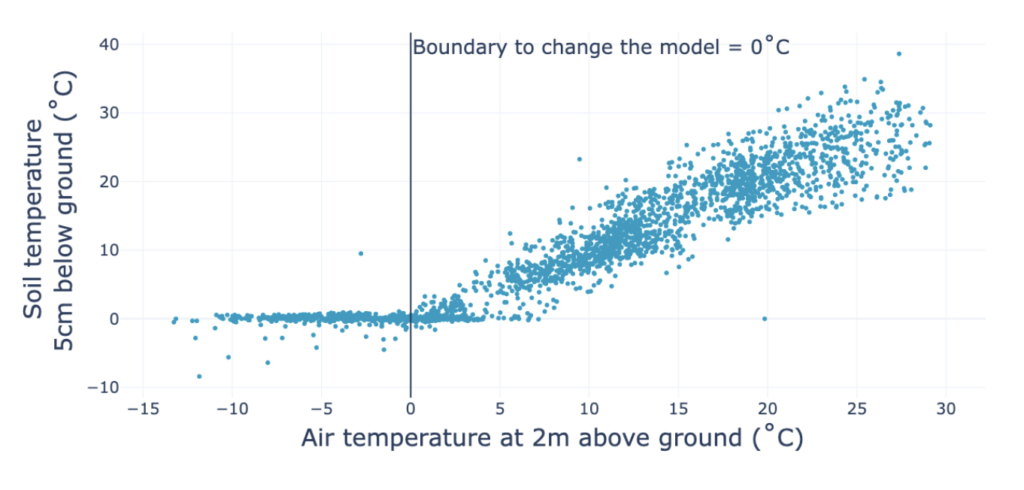
Figure 2. The relationship of soil and air temperature.
The analysis showed that the relationship between air and soil temperature changes in winter compared to other seasons (see Figure 2). Hence we created two linear models: one for when the air temperature is below 0 ℃ and one for all other occasions. To evaluate the model coefficients we used data from eight different local measuring devices – both soil sensors and weather stations. Two different points were used to evaluate the model and the results can be seen on figures 3 and 4. In the end, the mean absolute error of the winter temperatures model was around 0.4 ℃ and at other times around 2 ℃. This was considered a good accuracy for the results to be used for farming purposes.
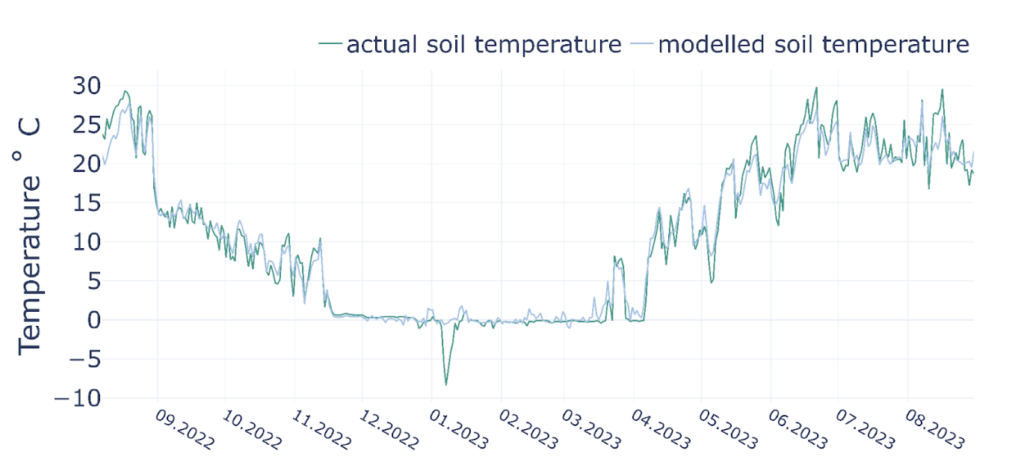
Figure 3. Modelled and actual soil temperatures for the validation point measured in Tartu-Tõravere weather station.
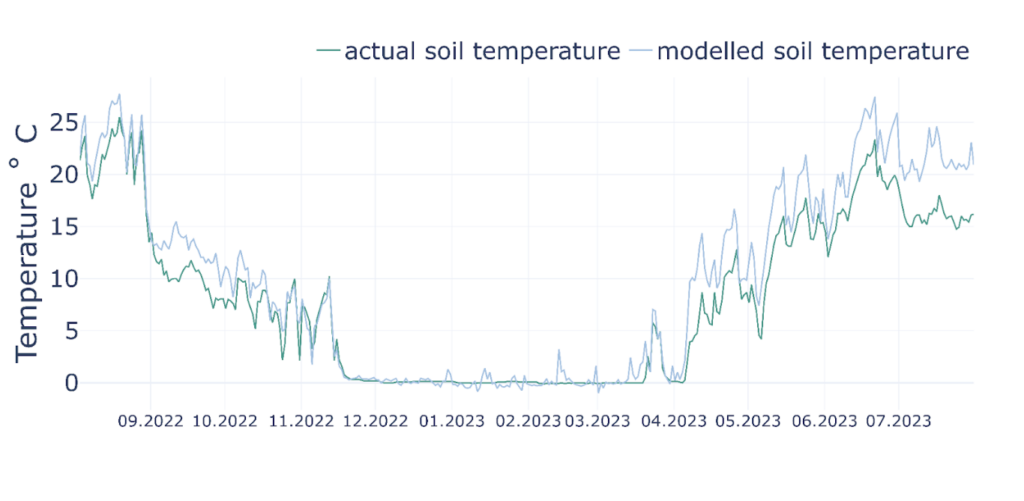
Figure 4. Modelled and actual soil temperatures for the validation point measured with a soil sensor near Jäneda.
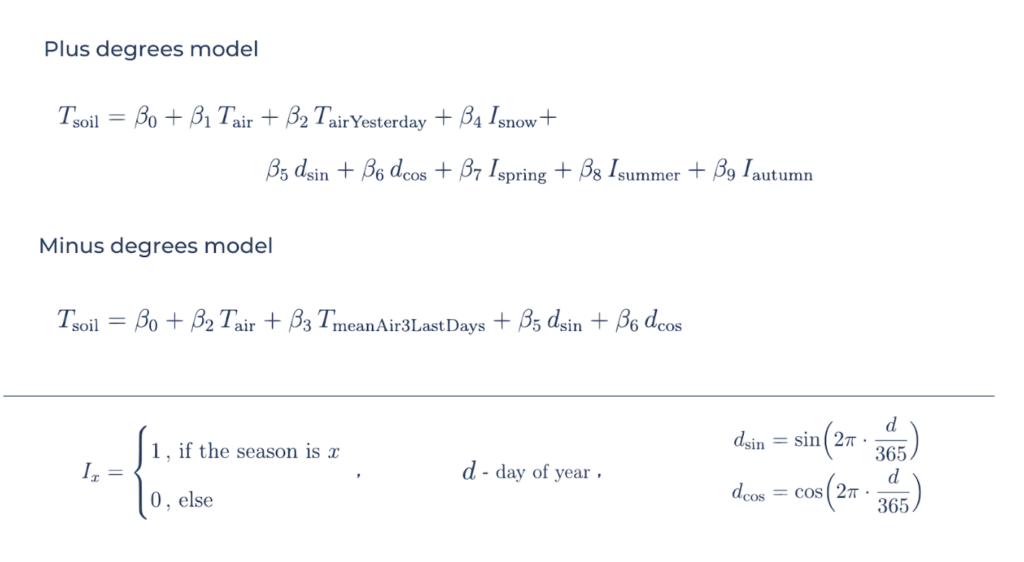
The final models are defined below:
The statistical challenges of modelling soil temperature
Every statistician knows that using statistical models comes with all kinds of assumptions. For linear regression one of the assumptions is that the model errors have to be equally distributed. However, when looking at the errors when using the linear regression with least squares method we saw heteroskedastic errors – as seen in Figure 5, for bigger soil temperatures the errors had a bigger variance.
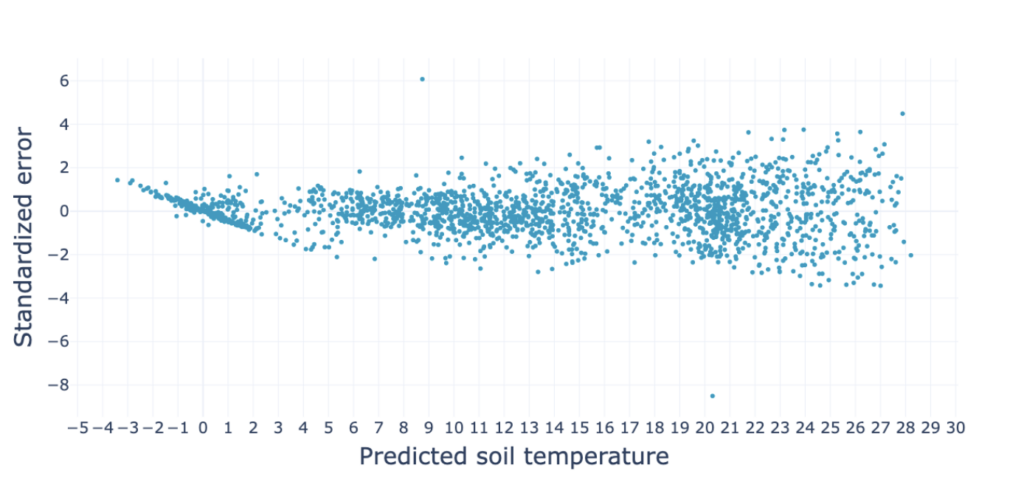
Figure 5. Scatterplot of the residuals for the plus degrees model estimated by the least squares method.
To combat this problem we used the weighted least squares (WLS) method when evaluating the model argument coefficients instead of the usual least squares method. The difference in the equations are described below where Y is the predicted variable Xi are the different features of the model, n is the amount of observations in our dataset and m is the amount of different features.
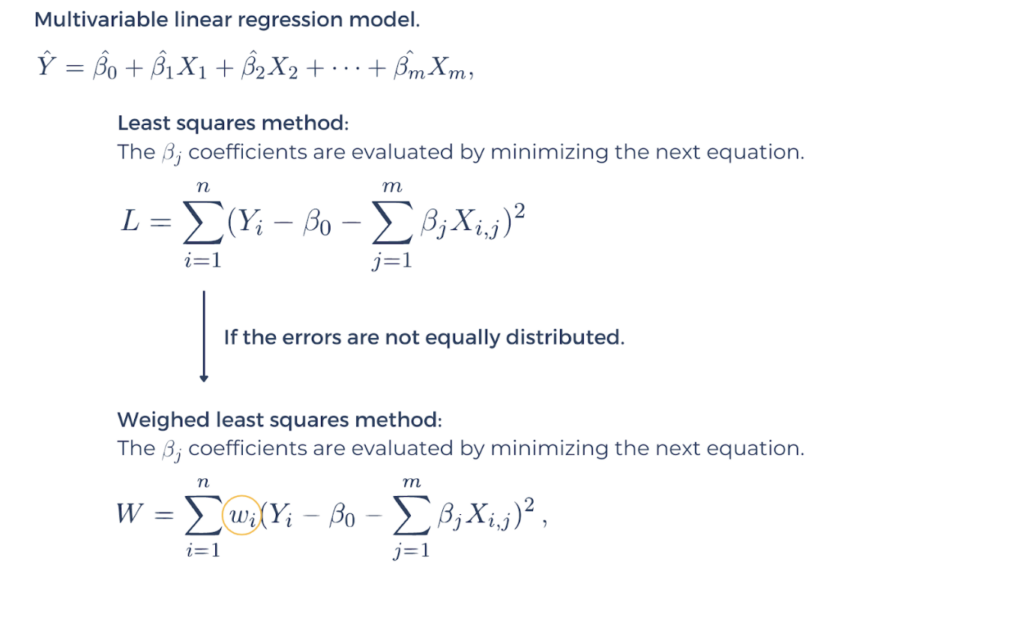
The most important are the weights Wi and the detailed explanation of how they were evaluated can be found in Lotta’s Bachelor’s thesis. With the WLS approach, the model errors had a much more equal distribution as can be seen in Figure 6.
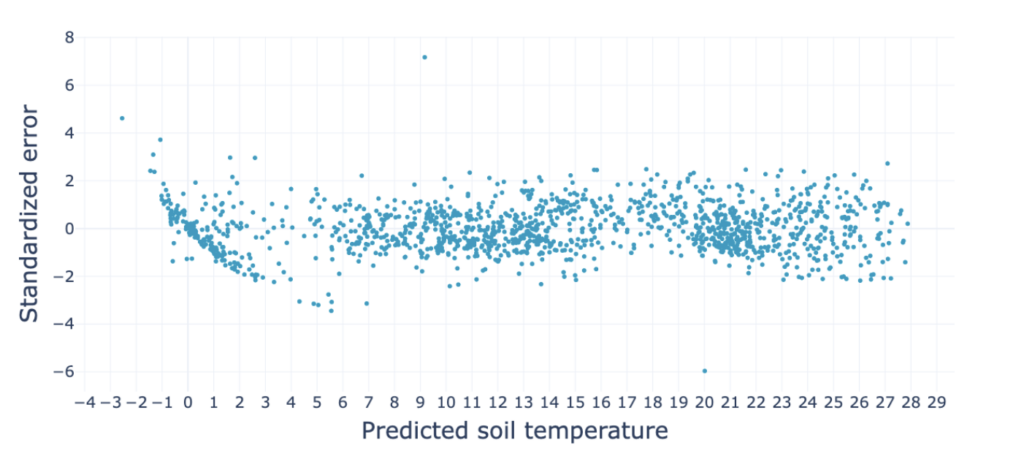
Figure 6. Scatterplot of the residuals for the plus degrees model estimated using the weighted least squares method.
Conclusion: harnessing simplicity for precision agriculture
In conclusion, the journey to accurately predict soil temperatures in Estonia without the extensive use of physical sensors has shown that simplicity can be powerful. Despite the limitations of satellite data and the impracticality of widespread sensor deployment, the linear regression models developed during this project offer a pragmatic and effective solution. By leveraging the strong relationship between air and soil temperatures, and addressing statistical challenges with the weighted least squares method, these models provide reliable soil temperature estimates essential for agronomy. The findings also pave the way for future improvements and applications, highlighting the potential of integrating meteorological and environmental data in agricultural practices.
Sources:
- Lotta-Lorette Kalmaru (2024). “Predicting Soil temperatures based on meteorological and remote sensing data“. https://dspace.ut.ee/items/0b22bb68-259f-4716-8d91-f2cbf65307c2
- Zheng, D., Jr. E. R. Hunt ja S. W. Running (1993). “A daily soil temperature model based on air temperature and precipitation for continental applications”. Climate Research 2, page 183–191.
- Hu, G., L. Zhao, R. Li, X. Wu, T. Wu, Q. Pang, G. Liu ja C Xie (2020). “A model for obtaining ground temperature from air temperature in permafrost regions on the Qinghai-Tibetan Plateau”. CATENA 189.2, page 104470.