The advances in information technology allow people to develop accurate machine learning models that can learn from collected data. The application of such models helps to predict the demand for various products, such as goods sold in grocery stores.
Retail chains sell a wide range of products which are ordered using different algorithms. One of them is the average buffer stock algorithm, which looks at how many products have been sold on average recently and assumes that future sales will follow a similar pattern.
Disadvantages of the average buffer method:
- the algorithm is not dynamic enough;
- the goods are either ordered in excessive amounts, which causes discards, or in too small amounts, which causes shortage;
- the algorithm is incapable of dealing with sudden changes such as holidays, campaign period, etc.;
- it takes too long for the customer to figure out the order quantity.
The supply chain management (SCM) model developed by STACC data scientists
The purpose of the model is to treat products with different demand volumes separately and apply different algorithms to products that are rarely sold vs. to products that are sold daily. The models and algorithms used are easy to interpret. Various potentially relevant factors, such as campaigns, holidays, and days of the week, are identified and their independent impact on sales over the next two weeks is predicted. The effects of the separated components can then be combined to form a single prediction.
Results
The resulting model is more flexible and adapts faster to changes in consumption than the previous demand forecasting algorithm Selver used. A better or at least as good prediction is obtained for more than 80% of the products. The overall prediction accuracy has almost doubled according to the mean square error (RMSE) in Figure 1 and the mean absolute percentage error (MAPE) in Figure 2. The model handles campaign periods well, as shown in Figures 3. and 4.
Figure 1. RMSE across different average quantity groups
Figure 1 shows how by many products the previously used algorithm (orange bars) erred on average for products with different volumes and how the new algorithm by STACC (purple bars) improved the metric. On the y-axis, the root mean square error is displayed. On the x-axis, there are three different quantity groups based on the amount of weekly sales. When the average sales of a product ranged from 10 to 50 products per week, the previously used algorithm erred by 20 products in its forecast on average, while the new algorithm by STACC reduced this figure to 13.

Figure 2. MAPE across different average quantity groups

Figure 2 is similar to Figure 1 but shows how the forecasts of both algorithms erred in percentages, displaying mean relative error on the Y-axis. When the average sales of a product ranged from 10 to 50 products per week, the mean relative error of the previously used algorithm was 178%, while that of the new algorithm was 83%.
The behavior of algorithms on popular products
Figures 3 and 4 show two popular products, their weekly sales over a few months, and the predictions of the two algorithms. The figures demonstrate that the algorithm developed by STACC can replicate actual sales well and also copes well with campaign periods.
In Figures 3 and 4, the solid gray line shows the actual sales, and the yellow background indicates when the product was in campaign. The dotted lines reflect the predictions made by the models – the red dotted line marks the forecast of the previous algorithm and the green dotted line marks the forecast of the algorithm developed by STACC. The figure shows that the algorithm developed by STACC is much more dynamic and thus able to predict the quantities sold much more accurately.
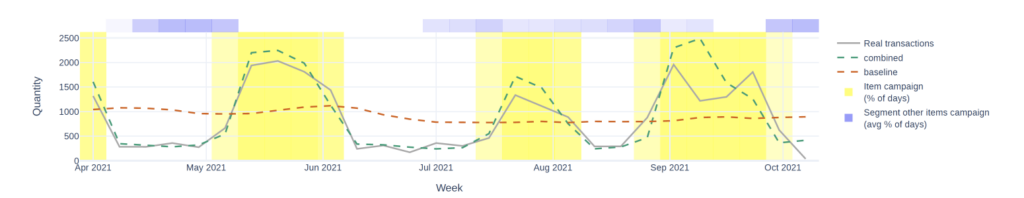
Figure 3. Comparison of forecasts and actual sales for “Butter” during the campaign and regular sales periods
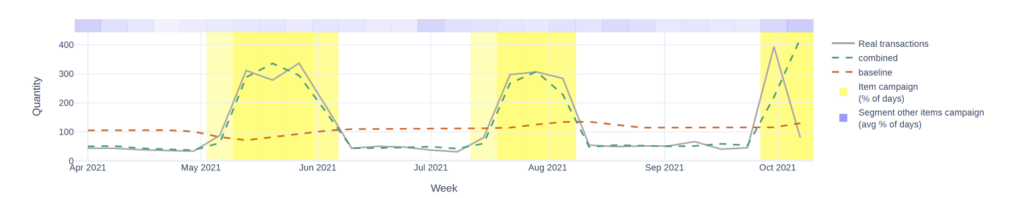
Figure 4. Comparison of forecasts and actual sales for “Toilet paper” during the campaign and regular sales periods
The model developed by STACC is more flexible and adapts faster to changes in consumption than the average buffer stock method previously used by the customer.
Conclusion
The model has been taken into use in all Selver stores across Estonia and is applied to products that were previously ordered using the average buffer stock method (~ 5000 products). The model forecasts demand for the next two weeks. The overall accuracy of predictions has almost doubled, making it possible to pre-order a more precise quantity of goods, which reduces waste and also saves valuable man-hours in calculating the amounts of goods to order.
STACC’s supply chain management model was developed in collaboration with Selver and Columbus.